We've all seen the red-state/blue-state electoral maps but do those images really portray how America really voted? Check out this map which depicts the 2008 elections results at a county level:
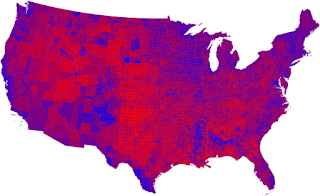
This image really intrigues me. As you can see there are pockets of people voting one way and it transitions into area's voting another way. Most of the solid blue area's center around highly populated urban area's and the more red around the more rural area's. If you think about the contrasts between the parties this makes sense. Liberal voters tend to congregate around area's that support their ideals and conservative voters towards areas that reflect theirs. This goes right along with a normal human tendency of wanting to be around people that think like you do. Pundits like to talk about transitioning the voter base towards their candidate but compare the image above with this one:

This is county level results for the 2004 election. Other than being a tad more red it's almost identical. So where is this transitioning of the voter base? The two maps clearly indicate the same deep blue and red areas but its the change in the purple areas that reflect this transition.
One thing I noticed was a blue area in southern Texas and central New Mexico. These area's aren't normal liberal hangouts, they're not urban, their not tree-hugger hang-outs, so they had me wondering why these area's fell so heavily Democrat. When I was discussing this phenomenon with my wife she reminded me that this area is mostly inhabited with lower income hispanics who normally vote for the Democrats. This year the Republicans thought they would be able to swing this group thinking that their stance towards abortion would swing the Catholic vote. As you can see they where not only wrong, the area actually increased for the Democrats. This is just one example on how the Republicans misled themselves on what people though was important. As with almost every election this is an indicator of why people vote one way versus the other, and the number one reason is their pocketbook. If Republicans learned anything after this election I hope it's that we need to have a platform that attracts this type of voter. Learn the lessons of Reagan and hold true to fiscal conservatism, this will do it every time.
So what do these maps tell us? First off you can tell that no matter who is the candidate and what is happening in the world you will not be able to swing the hard core Democrat or Republican. Second, you must have a platform that appeals to the moderate but holds true to your own values. Fiscal conservatism does this; it puts money into the workers pocket as well as protect corporations and small businesses; this in turn expands our economy thus generating more revenue. We are the most powerful nation in the world and it's about time we re-adopted the values that got us there. This is how we move the map more red, put the money back into the people pocket. Not by giving it to them (such as with a stimulus package) but by real tangible prosperity that people can rely on. In other words; don't give a hand-out, give a hand up. That's how you win elections.


0 Reader Comments:
Post a Comment